

C# is a powerful and versatile programming language widely used across enterprise software, cloud applications, desktop systems, and game development. As a core component of the .NET ecosystem, C# benefits from a mature set of frameworks and tools that help developers build robust and scalable solutions.
With the increasing size and complexity of codebases, maintaining code quality, performance, and security becomes a serious challenge. Small bugs can evolve into expensive issues, unoptimized code can reduce efficiency, and unnoticed security flaws can expose systems to real threats. Static code analysis tools offer a practical and proactive way to address these concerns before they surface in production.
Analyze С# Code Risk
Smart TS XL enhances C# static findings by correlating execution paths with architectural risk exposure.
Explore nowStatic analysis examines source code without executing it. It detects syntax errors, code smells, performance bottlenecks, maintainability risks, and even security vulnerabilities. These tools help developers and teams enforce coding standards, track technical debt, and ensure long-term maintainability of their software.
The C# ecosystem offers a wide range of static analysis solutions. Some integrate directly into Visual Studio and support real-time feedback during development. Others offer deeper insights and integrate with build pipelines for continuous quality monitoring. Each tool serves a different purpose, whether it’s catching logic errors early, improving readability, or ensuring compliance with security policies.
Explore the leading static analysis tools available for C# development. It compares their features, highlights their strengths, and explains where each fits best within a modern development workflow. Whether your goal is better code quality, fewer bugs, stronger security, or smoother code reviews, the right analysis tools can help you get there faster and with more confidence.
SMART TS XL
SMART TS XL stands out as a comprehensive static code analysis solution tailored for enterprise-grade applications, and its support for C# makes it a strong contender in the modern .NET ecosystem. Designed to scale with large, complex software systems, SMART TS XL provides deep visibility into code structure, flow, and interdependencies, enabling developers and teams to improve maintainability, compliance, and risk management across the entire codebase.
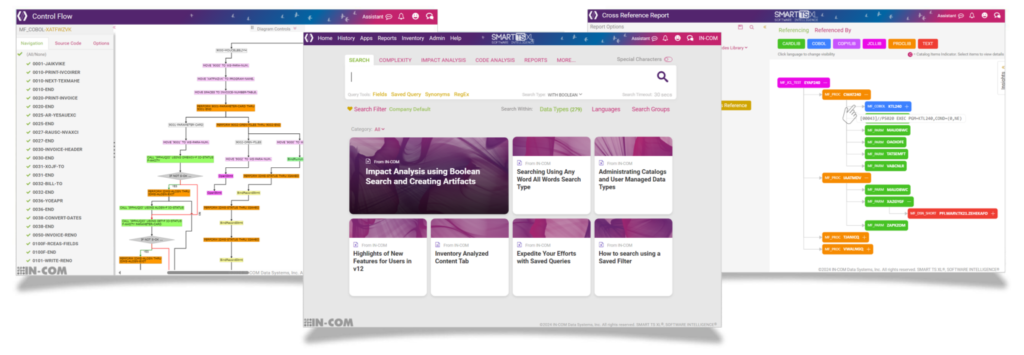
What sets SMART TS XL apart is its focus on delivering both high-level architectural insight and granular code-level diagnostics. It is especially effective in environments where legacy systems and modern C# code coexist, offering cross-language analysis and support for hybrid codebases. SMART TS XL is used widely in highly regulated industries where audit trails, rule enforcement, and traceability are critical.
Advantages of SMART TS XL for C# Static Analysis
- Visualizes the full call flow and logic paths across classes, assemblies, and services
- Identifies hidden dependencies and dead code within large C# applications
- Supports customizable rule sets for enforcing coding standards and architectural policies
- Integrates with CI/CD pipelines to automate quality checks and code validation
- Offers powerful impact analysis to support refactoring and modernization efforts
- Scales effectively across thousands of files and multiple code repositories
- Facilitates compliance with security and industry standards such as OWASP, ISO, and MISRA
SMART TS XL is ideal for organizations looking to strengthen their control over complex C# systems, reduce technical debt, and support long-term software maintainability. With its flexible architecture and enterprise-grade capabilities, it is well suited for developers, architects, and IT leaders focused on sustainable and secure .NET development.
ReSharper
ReSharper, developed by JetBrains, is one of the most popular and developer-friendly static analysis and productivity tools for C# and the wider .NET ecosystem. Integrated directly into Visual Studio, ReSharper enhances the coding experience with real-time code inspection, intelligent suggestions, refactoring capabilities, and code navigation features. It supports a broad set of C# language features and frameworks, making it a staple in many professional development environments.
ReSharper analyzes code as you type, highlighting issues ranging from syntax errors and potential runtime bugs to code smells and maintainability concerns. It provides quick-fix suggestions and context-sensitive refactoring actions, enabling developers to improve code quality with minimal disruption. Beyond analysis, it includes unit testing tools, code generation helpers, and navigation shortcuts that significantly speed up development.
Advantages
- Deep integration with Visual Studio for seamless developer experience
- Real-time code inspections for C#, ASP.NET, XAML, and other .NET languages
- Over 2,000 code quality checks and dozens of refactorings
- Instant code navigation and search tools for exploring large codebases
- Context-aware code completion and syntax suggestions
- Customizable inspection severity and rules for team-specific standards
- Built-in unit test runner supporting NUnit, MSTest, xUnit, and more
Limitations and Shortcomings
Despite its strengths, ReSharper has notable limitations that may affect its suitability for large-scale or CI-integrated static analysis use cases:
- Performance overhead
ReSharper is known to significantly increase memory usage and startup time in Visual Studio, especially on large solutions. It can slow down IDE responsiveness, which frustrates developers working with complex enterprise codebases. - No standalone CLI or CI toolchain integration
ReSharper is designed for interactive use within Visual Studio. It does not offer a fully supported standalone command-line interface for integration into CI/CD pipelines, which limits its use for automated quality gates in continuous integration workflows. - Limited architectural analysis
While excellent for code-level issues, ReSharper does not provide architectural dependency maps, system-wide call graphs, or advanced flow analysis across microservices or cross-repository environments. - Not suitable for cross-language codebases
ReSharper’s primary focus is .NET. It does not support multi-language systems involving Java, C++, or COBOL, limiting its effectiveness in hybrid or legacy modernization contexts. - Commercial licensing
ReSharper is a paid product with per-seat licenses. For large teams, this can be a significant expense compared to open-source or CI-based tools that offer broader automation without per-user cost. - No built-in security scanning
ReSharper lacks dedicated static application security testing (SAST) capabilities, such as detecting injection vulnerabilities, insecure cryptography, or authentication issues. For secure development practices, complementary tools are needed.
ReSharper remains a top-tier tool for boosting individual and team productivity within Visual Studio and is ideal for rapid development cycles and code reviews. However, organizations looking for CI-first, scalable, or security-focused static analysis may need to supplement it with other tools.
Roslyn Analyzers

Roslyn Analyzers are a set of open-source diagnostic tools built on top of the Roslyn compiler platform, which powers modern C# and Visual Basic .NET compilers. Developed and maintained by Microsoft, these analyzers enable developers to write, enforce, and extend custom static code rules within the .NET ecosystem. They are integrated directly into the build process and Visual Studio, making them lightweight and effective for both local development and continuous integration.
Roslyn Analyzers form the basis for many other rule sets, including those in Microsoft.CodeAnalysis, .NET SDK analyzers, and Microsoft’s own security, API, and compatibility guidelines. They are ideal for ensuring code consistency, catching common bugs, and applying style rules across C# projects in a scalable and automated way.
Advantages
- Built into .NET SDK and supported by Microsoft
- Enforces official Microsoft guidelines and style conventions
- Integrates natively into Visual Studio and MSBuild processes
- Supports custom rule authoring in C# with flexible APIs
- Efficient for real-time feedback and CI pipeline integration
- Compatible with Visual Studio Code via OmniSharp
- Community-driven with ongoing updates and rule improvements
Limitations and Shortcomings
Despite its utility and native integration, Roslyn Analyzers have several areas where they fall short for advanced static analysis needs:
- Limited depth in code flow and architecture analysis
Roslyn Analyzers work primarily at the syntax and semantic levels. They lack deep interprocedural flow analysis, cross-project dependency mapping, and architectural rule enforcement that enterprise tools like SMART TS XL or NDepend offer. - Lack of built-in security rule sets
Out-of-the-box Roslyn Analyzers do not focus on security vulnerabilities such as input sanitization, data leakage, or unsafe API usage. Security-focused extensions (e.g., Microsoft Security Code Analysis) are needed for SAST capabilities. - Minimal visualization tools
There is no support for call graphs, dependency graphs, or rich UI interfaces for understanding complex codebases. Developers must rely on textual output or third-party integrations for visual feedback. - Maintenance overhead for custom rules
While rule customization is powerful, it also requires in-depth knowledge of the Roslyn APIs and regular maintenance as codebases evolve. This can be a burden for teams without dedicated tooling expertise. - Basic error reporting and workflow integration
Compared to tools like SonarQube or CodeQL, Roslyn Analyzers have limited reporting dashboards, issue tracking features, and integration with platforms like GitHub PR reviews or Jira. - Not ideal for multi-language solutions
These analyzers are specific to C# and VB.NET. They cannot handle mixed stacks involving JavaScript, C++, COBOL, or other enterprise languages.
Roslyn Analyzers are a lightweight and effective first line of defense for maintaining quality in C# code. They are ideal for enforcing consistency, catching simple issues early, and integrating into CI workflows with minimal setup. However, for organizations needing deeper insights, security compliance, or architectural governance, Roslyn Analyzers serve best when combined with more robust static analysis platforms.
NDepend
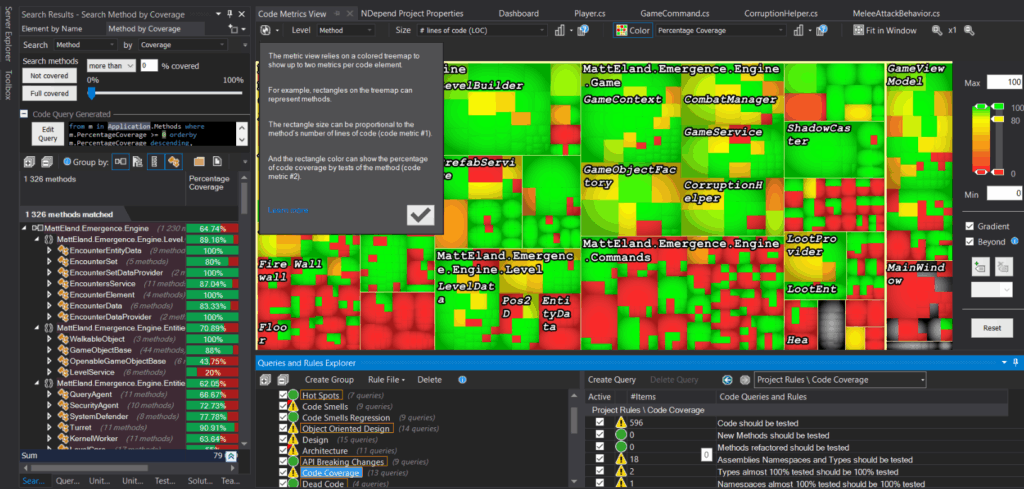
NDepend is a powerful static analysis and architectural governance tool specifically designed for .NET codebases, including C#. It offers advanced code metrics, dependency visualization, code rule enforcement, and technical debt tracking. NDepend integrates with Visual Studio, CI/CD pipelines, and supports custom rule definition via its own LINQ-based query language (CQLinq).
Its primary strengths lie in its deep insight into code structure, architectural consistency, and the ability to enforce enterprise-wide coding standards. For teams working on complex or long-lived .NET solutions, NDepend provides a high level of transparency and maintainability.
Advantages
- Extensive code metrics (e.g., cyclomatic complexity, coupling, cohesion)
- Dependency graphs and matrices for architecture visualization
- CQLinq query language to write and customize code rules
- Supports trend analysis and technical debt tracking over time
- Integration with Visual Studio and Azure DevOps
- Static analysis for both source code and compiled assemblies
- Detects code smells, anti-patterns, and potential refactoring targets
- Ideal for large, layered, or legacy enterprise codebases
Limitations and Shortcomings
While NDepend delivers unparalleled depth in analysis and visualization, it does come with several drawbacks that may affect its adoption in certain environments:
- Complexity and steep learning curve
NDepend’s extensive features, especially CQLinq and dependency mapping, can be overwhelming for newcomers. Teams need training to effectively leverage its capabilities, and casual users may find the interface and setup non-intuitive. - Limited real-time feedback during development
Unlike tools like ReSharper or Roslyn Analyzers that provide immediate in-editor diagnostics, NDepend’s feedback is generally post-analysis. Developers may need to trigger manual or scheduled runs to view results. - Visual Studio dependency
While NDepend offers command-line and CI integration, its most feature-rich experience is tied to Visual Studio. Developers using Rider or Visual Studio Code may not get full support. - Primarily for architecture and metrics
NDepend is exceptional at structural and architectural validation, but it lacks depth in certain areas like syntax-level linting or formatting rules. It does not enforce naming conventions or whitespace rules like StyleCop or EditorConfig. - No built-in security scanning
The tool does not natively detect common security vulnerabilities such as SQL injection, insecure cryptography, or path traversal risks. Security-focused organizations must pair it with tools like SMART TS XL, CodeQL, or Veracode. - Commercial licensing model
NDepend is a paid product with per-seat licenses, which may be prohibitive for small teams or open-source contributors compared to free options like Roslyn Analyzers or ESLint. - Not suited for polyglot codebases
As a .NET-centric tool, NDepend does not support JavaScript, Python, COBOL, or other non-.NET languages often found in full-stack or legacy enterprise environments.
NDepend is a strategic solution for maintaining long-term code quality and architectural clarity in C# projects. It excels in detecting deep structural issues and helps teams quantify technical debt and enforce layered design. However, it works best when complemented by lightweight, real-time linters and security tools in a holistic development workflow.
PVS-Studio
PVS-Studio is a static code analyzer developed by Program Verification Systems, supporting multiple languages including C, C++, C#, and Java. For C#, it integrates into Visual Studio and offers deep analysis for detecting bugs, code smells, concurrency issues, and security vulnerabilities. PVS-Studio emphasizes high-performance detection capabilities and is used by many teams across embedded systems, financial services, and large-scale enterprise applications.

It provides a comprehensive ruleset that goes beyond basic syntax errors to uncover subtle logic issues, undefined behaviors, and coding pattern violations. The tool supports both manual and CI-integrated analysis workflows.
Advantages
- Detects a wide range of error types in C#, from logical flaws to performance inefficiencies
- Integrates seamlessly with Visual Studio and supports MSBuild-based projects
- Offers a command-line interface for automation and CI/CD pipeline use
- Provides classification of warnings by severity and likelihood of false positives
- Maintains a dedicated database of false positive suppression mechanisms
- Offers detailed documentation and examples for every diagnostic rule
- Supports incremental analysis for faster performance in large projects
Limitations and Shortcomings
Despite its technical strength, PVS-Studio has several aspects that can limit its adoption or effectiveness in certain environments:
- Verbose output and warning noise
PVS-Studio can produce a high number of warnings, especially on first run. Although it includes suppression tools, the initial noise can be overwhelming, requiring dedicated effort to tune for productive use. - Limited customization of rules
Unlike Roslyn Analyzers or NDepend, PVS-Studio does not offer a powerful custom rule engine. Developers cannot easily define bespoke rules tailored to their internal architecture or coding standards. - Lack of architectural insight
The tool focuses primarily on error detection rather than architecture validation. It does not offer features like dependency graphs, cyclomatic complexity tracking, or layered design enforcement. - Steep licensing cost
PVS-Studio is a commercial tool with a licensing model that may be expensive for smaller development teams or educational environments. No free tier exists for professional use beyond a trial period. - Less developer-friendly UX
While the integration with Visual Studio is functional, the interface lacks some of the refinement and usability features found in tools like ReSharper or SonarQube dashboards. - Security focus less robust than dedicated SAST tools
Although it detects some security-related issues, PVS-Studio is not a replacement for dedicated static application security testing platforms. It lacks OWASP rule sets, taint analysis, and vulnerability scoring integration. - Primarily Microsoft stack focused
Even though the tool supports multiple languages, its best C# capabilities rely on a Microsoft ecosystem. Cross-platform .NET Core or VS Code usage may feel limited in comparison.
PVS-Studio is a mature and technically impressive tool for surfacing C# code defects and hidden issues that other analyzers might miss. It is especially valuable for legacy projects, safety-critical systems, and teams that need an additional layer of quality control. However, for organizations looking for rule customization, architectural control, or more user-friendly workflows, it may need to be paired with more interactive or strategic tooling.
Coverity (Synopsys)
Coverity is an enterprise-grade static application security testing (SAST) tool that supports a wide array of programming languages, including C#. It is widely adopted by organizations in finance, aerospace, healthcare, and other regulated industries due to its strong emphasis on code security, reliability, and compliance.
Coverity performs deep static analysis to detect critical software defects, security vulnerabilities, concurrency issues, and compliance violations. It aligns with industry standards such as CWE, OWASP Top 10, and MISRA, and is known for its scalability across large codebases and its enterprise-level reporting capabilities.
Advantages
- Advanced vulnerability detection, including buffer overflows, injection flaws, and unsafe APIs
- Strong compliance alignment with industry standards (CWE, OWASP, PCI DSS, etc.)
- Integrates with Visual Studio and CI/CD platforms like Jenkins, GitHub Actions, and Azure DevOps
- Provides code triaging tools and collaborative workflow for defect remediation
- Handles large enterprise codebases with performance-focused analysis engine
- Supports centralized dashboards and auditing features
- Offers high-quality rule sets curated for security and safety
Limitations and Shortcomings
While Coverity excels in secure code analysis, especially in regulated environments, it comes with trade-offs that developers and DevOps teams should be aware of:
- Heavy setup and infrastructure overhead
Coverity requires considerable setup, including backend servers and configuration of scanning infrastructure. It’s not well-suited for fast-moving teams or small projects without dedicated DevSecOps resources. - High licensing and support costs
The pricing structure is geared toward large enterprises. Smaller companies or freelance developers will find the licensing cost prohibitively expensive compared to open-source or lightweight alternatives. - Limited real-time feedback during coding
Coverity operates best in batch-mode or CI-based scanning. Developers do not get instant inline feedback as they would with Roslyn analyzers, ReSharper, or Visual Studio’s built-in tooling. - Steep learning curve for configuration
Customizing analysis profiles, suppressions, or rules requires training and familiarity with Coverity’s unique configuration ecosystem. Documentation is extensive but can be dense. - Focused more on security than maintainability or architecture
Coverity specializes in security and reliability detection but lacks architectural tools like dependency graphs, technical debt tracking, or trend metrics that tools like NDepend provide. - UI and user experience not modernized
The developer interface and dashboard, while functional, lag behind modern design standards. Compared to user-centric tools like SonarQube or CodeClimate, Coverity can feel dated and cumbersome. - Requires periodic tuning to avoid false positives
While Coverity is praised for its precision, some users report false positives, especially when using advanced language features or custom frameworks. This necessitates ongoing refinement of rules and suppressions.
Coverity is a top-tier solution for organizations where security, compliance, and code correctness are non-negotiable. It’s ideal for large-scale, regulated, or legacy codebases that demand rigorous defect analysis. However, its enterprise-grade nature means it may not be agile or lightweight enough for smaller teams or rapid development environments without proper support and training.
CodeRush
CodeRush by DevExpress is a productivity extension for Visual Studio that includes code navigation, refactoring, and static code analysis capabilities. Designed with a strong emphasis on developer experience, CodeRush enhances code quality and maintainability while boosting efficiency in writing, reading, and navigating C# code.
While not purely a static code analyzer like Coverity or PVS-Studio, CodeRush incorporates a real-time code diagnostics engine that helps developers adhere to best practices, avoid errors, and simplify codebases.
Advantages
- Integrates directly into Visual Studio with minimal setup
- Provides instant static code analysis and suggestions as developers write code
- Includes over 100 automated refactorings and code formatting tools
- Highlights potential performance issues, unused code, and bad practices
- Offers visual tools like code metrics, dependency analysis, and code coverage
- Streamlines common developer tasks (e.g., renaming, reordering parameters, changing visibility)
- Allows rule configuration and suppression per project or developer preference
- Lightweight and fast, designed to support modern C# workflows
Limitations and Shortcomings
Despite its appeal to individual developers and small teams, CodeRush has several constraints that reduce its utility in enterprise-grade static analysis scenarios:
- Not a dedicated SAST or security scanner
CodeRush focuses on code style, structure, and developer productivity. It does not specialize in vulnerability detection or compliance with standards like OWASP or CWE. - Lacks enterprise reporting features
It does not provide centralized dashboards, defect trend tracking, or reporting capabilities suited for team-wide analysis across CI pipelines. - Limited rule extensibility
Compared to Roslyn analyzers or tools like NDepend, CodeRush does not offer an extensive framework for building and enforcing custom static analysis rules or architectural constraints. - No command-line or CI/CD integration
Analysis is performed entirely within the Visual Studio environment. There is no support for headless execution in build pipelines or remote analysis infrastructure. - No deep dataflow or taint analysis
CodeRush does not perform path-sensitive analysis, interprocedural scanning, or advanced data flow tracing. Therefore, it may miss complex bugs that span multiple files or layers. - More productivity-oriented than quality enforcement
The focus on developer ergonomics can result in less rigorous enforcement of code standards compared to tools like SonarQube or Coverity, which prioritize defect accuracy. - Not ideal for large or legacy codebases
While responsive in small to mid-size projects, CodeRush may not scale efficiently in massive enterprise repositories requiring deep static checks, audits, or compliance evaluation.
CodeRush excels as a developer-centric productivity enhancer with valuable static code feedback and smart refactorings for C#. However, it does not replace formal static code analysis platforms used in DevSecOps or large team environments. It pairs well with other tools when instant feedback and clean code habits are desired on the individual level.
StyleCop
StyleCop is a static code analysis tool developed by Microsoft (and later maintained by the community as StyleCop.Analyzers) that focuses specifically on enforcing consistent code style and formatting in C#. It analyzes C# source code to ensure it adheres to a defined set of style rules, improving readability, maintainability, and team consistency.
Rather than detecting security flaws or complex logic errors, StyleCop emphasizes clarity, naming conventions, spacing, layout, and documentation.
Advantages
- Promotes consistent coding style across teams and large codebases
- Offers a wide range of customizable rules for formatting, naming, ordering, and commenting
- Integrated with Visual Studio and compatible with Roslyn analyzers
- Enforces code style at compile time, helping maintain quality during development
- Can be extended via configuration files or additional rulesets
- Easily integrated into build pipelines and CI environments (via NuGet or MSBuild)
- Encourages clean, readable, and well-documented C# code
Limitations and Shortcomings
Despite its usefulness for standardization, StyleCop has several limitations that reduce its impact in broader static analysis contexts:
- Focuses only on code style, not correctness or security
StyleCop does not detect bugs, performance issues, or vulnerabilities. It complements tools like Roslyn analyzers or SonarQube but does not replace them. - Can be overly strict and verbose
StyleCop rules are numerous and often strict. Without thoughtful configuration, teams may find themselves overwhelmed by warnings for non-critical style issues, which can disrupt focus or cause rule fatigue. - Limited support for modern C# constructs
While StyleCop.Analyzers has improved compatibility with newer C# versions (like records, pattern matching, or nullable reference types), support has occasionally lagged behind compiler updates, causing friction in fast-evolving projects. - No visual reporting or metrics
Unlike SonarQube or NDepend, StyleCop lacks dashboards, charts, or trend tracking. It only shows warnings in the IDE or build output, limiting team-wide visibility. - No architectural or complexity analysis
StyleCop does not analyze code dependencies, class structure, or maintainability indexes. It focuses on superficial consistency, not deeper design quality. - Can be intrusive if not configured properly
Enabling StyleCop in existing projects can flood builds with warnings. Teams must carefully tune rules to balance enforcement with practicality, especially during adoption. - Dependent on community maintenance
Since the original Microsoft project was archived, ongoing development relies on community contributors. While active, long-term sustainability may concern enterprises relying on frequent updates and support.
StyleCop remains a valuable tool for teams that prioritize clean and standardized code. However, for comprehensive static code analysis especially in areas like security, maintainability, or performance it should be used in tandem with other tools.
FxCop
FxCop was one of the earliest static analysis tools developed by Microsoft, targeting .NET managed code. It analyzes compiled assemblies (IL code) rather than source code, allowing it to check against Microsoft’s .NET Framework Design Guidelines. Over time, it evolved into FxCop Analyzers, a set of Roslyn-based analyzers integrated with Visual Studio and MSBuild that analyze C# and VB.NET code during compilation.
While the original standalone FxCop is deprecated, the FxCop analyzers package remains in wide use and has largely been absorbed into the .NET SDK analyzers as part of modern .NET development.
Advantages
- Built and maintained by Microsoft, ensuring deep integration with Visual Studio and the .NET SDK
- Analyzes code at build time using Roslyn, providing fast and real-time feedback
- Helps enforce best practices, naming conventions, performance suggestions, and design guideline compliance
- Supports rule suppression and customization via rule sets and editorconfig
- Easy to install via NuGet and integrate into existing .NET Core or .NET 5+ projects
- Rich set of rules covering usage, globalization, reliability, maintainability, and more
- Active development now shifted to .NET Analyzers, ensuring future continuity
Limitations and Shortcomings
While FxCop analyzers are useful for enforcing .NET design rules, there are several key limitations:
- No security-focused analysis
FxCop does not cover in-depth security flaws, taint tracking, or common vulnerabilities like XSS or SQL injection. For security assurance, tools like CodeQL, Veracode, or Fortify are required. - Limited extensibility
Custom rule creation is possible but complex compared to some other analyzer frameworks. Enterprises seeking custom policy enforcement might find Roslyn Analyzer development more flexible. - Deprecated standalone version
The original FxCop GUI and IL-level analysis tool is no longer maintained. Legacy users must transition to Roslyn-based analyzers, which differ in behavior and scope. - Not designed for architectural or dependency analysis
FxCop does not provide insight into system architecture, module dependencies, or layered violations. Tools like NDepend are better suited for these concerns. - Lack of visual dashboards or metrics
FxCop offers no native UI for reporting, trend tracking, or team-wide dashboards. It relies on IDE diagnostics or build output for feedback, limiting visibility for teams and managers. - Overlap with .NET SDK Analyzers
In modern .NET versions, many FxCop rules are merged into the SDK’s built-in analyzers. This can lead to confusion or duplication unless rule sets are carefully managed. - Poor support for non-MSBuild environments
Projects outside the MSBuild ecosystem (e.g., using Bazel or custom build systems) face friction in integrating FxCop-style rules.
FxCop (in its current Roslyn-based form) remains a solid, Microsoft-supported static analysis foundation for C# projects particularly for teams looking to enforce standard coding and design rules. However, it is best complemented with additional tools for architectural validation, security scanning, and visual reporting in enterprise scenarios.
Fortify Static Code Analyzer
Fortify SCA is an enterprise-grade static analysis platform designed to detect security vulnerabilities and code quality issues across a broad range of programming languages, including C#. It scans source code, configuration files, and build artifacts to identify potential risks early in the development lifecycle. Fortify is widely used in highly regulated industries like finance, healthcare, and government due to its rigorous compliance and security standards.
Advantages
- Broad language and framework support, including full coverage for modern C# and .NET applications
- Detects a wide range of security flaws including injection vulnerabilities, insecure cryptography, authentication issues, and more
- Incorporates industry standards like CWE, OWASP Top 10, and SANS 25 in its vulnerability categorization
- Integration support with CI/CD tools, IDEs (such as Visual Studio), and DevSecOps pipelines
- Detailed reports with prioritized remediation guidance
- Offers Software Security Center (SSC) for enterprise-level governance, tracking, and risk management
- Supports custom rulepacks and configuration for domain-specific policies
- Backed by a long-standing security research team and regular rulepack updates
- Includes support for both cloud-native and legacy .NET applications
Limitations and Shortcomings
While Fortify SCA is powerful, its complexity and enterprise focus come with certain trade-offs:
- High learning curve
The setup, configuration, and tuning of Fortify can be complex. It often requires dedicated security engineers or consultants to deploy effectively. - Performance impact on large codebases
Full scans can be time-consuming, especially on large or monolithic applications. Incremental or partial scans are available but require careful tuning. - Expensive licensing
Fortify is among the most costly solutions on the market, often priced beyond reach for small or mid-sized teams. Licensing is typically tiered by application size and user seats. - Steep onboarding for developers
Developers unfamiliar with security concepts may find Fortify’s detailed reports dense and difficult to interpret. Integration with IDEs helps, but context is sometimes lacking without training. - Rulepack tuning required
Out-of-the-box rules may produce a high volume of warnings or false positives. Teams must invest time tuning rules for project-specific contexts to get actionable results. - Limited architectural or code quality insights
While Fortify excels at security scanning, it offers limited visibility into software maintainability, code complexity, or architectural conformance. Complementary tools are often required for a holistic view. - Build integration challenges
Non-standard build environments or custom pipelines may require additional effort to fully integrate Fortify scans into CI/CD workflows.
Fortify is best suited for organizations with mature security practices, regulated environments, and complex C# applications that require deep vulnerability scanning and centralized risk governance. For smaller teams or projects prioritizing speed and usability over exhaustive depth, lighter tools may offer better cost-to-value ratios.
Checkmarx
Checkmarx is a leading enterprise SAST platform that helps organizations identify and remediate security vulnerabilities in source code early in the development lifecycle. It supports a broad set of languages and frameworks, with deep analysis capabilities for C# and .NET environments, including ASP.NET, Blazor, and legacy .NET Framework apps. Designed for integration into modern DevSecOps workflows, Checkmarx is widely adopted across sectors like finance, healthcare, and defense.
Advantages
- Comprehensive support for C# and .NET-based projects including full syntax, semantic, and flow analysis
- Effectively detects vulnerabilities like SQL injection, cross-site scripting, hardcoded secrets, insecure deserialization, and authentication flaws
- Leverages data flow and control flow modeling to provide contextualized vulnerability tracing
- Integrates with Visual Studio, Azure DevOps, GitHub, GitLab, Jenkins, and more
- Customizable scanning policies and compliance mapping (e.g., OWASP Top 10, PCI DSS, HIPAA, GDPR)
- Includes remediation guidance with examples to help developers fix issues faster
- Centralized dashboard and reporting for risk management, compliance, and audit readiness
- Offers a managed cloud-based scanning service (Checkmarx One) as well as on-premises deployment
- Supports integration with Software Composition Analysis (SCA) and Infrastructure as Code (IaC) tools
Limitations and Shortcomings
Despite its enterprise strengths, Checkmarx comes with several caveats that are especially relevant for teams working with C#:
- Resource-heavy and complex setup
Initial configuration, including rule tuning and CI integration, can be time-consuming. Effective deployment often requires onboarding assistance or vendor support. - False positives in legacy C# codebases
Older or non-standard code patterns (e.g., with dynamic reflection or ADO.NET) may lead to higher false positive rates unless scan rules are customized. - Limited architectural/code quality metrics
While Checkmarx is excellent for security vulnerabilities, it provides limited insight into maintainability, modularity, or adherence to clean architecture principles. Tools like NDepend or ReSharper remain needed for quality enforcement. - High cost and enterprise focus
Licensing costs are significant and may not scale well for small teams or startups. The platform is primarily geared toward large development environments and security-first enterprises. - Scan duration on large C# projects
Deep scan precision increases processing time. On monolithic or tightly coupled codebases, scans can slow down pipelines without optimization. - No deep integration with some .NET-specific workflows
Compared to Microsoft-native tools, integration with features like analyzers, nullable reference types, or runtime-specific configurations may lack depth. - Learning curve for developers
Developers unfamiliar with secure coding or advanced vulnerability types may find the report output difficult to interpret without guidance or training.
Checkmarx is best suited for enterprise-grade .NET/C# applications requiring robust, automated vulnerability detection across development pipelines. While powerful in terms of depth and control, it may be overkill or too resource-intensive for teams that need lightweight or real-time static code feedback.
Veracode Static Analysis
Veracode offers a cloud-native static application security testing (SAST) platform known for ease of onboarding and enterprise governance. It is widely used in industries with strong compliance mandates, such as banking, healthcare, and insurance. For C# developers and .NET teams, Veracode supports analysis of both web and desktop applications, including ASP.NET Core, Blazor, and legacy .NET Framework projects.
Advantages
- Full support for modern and legacy C# codebases, including .NET Core and .NET 6+
- Detects a wide array of vulnerabilities including injection, cryptographic flaws, insecure APIs, and business logic issues
- No local infrastructure required due to its fully cloud-based architecture
- Simple upload-and-scan model using precompiled binaries (DLLs, EXEs, etc.)
- Complies with OWASP Top 10, CWE, SANS 25, and industry-specific regulations
- Supports policy-driven development with automatic enforcement of secure coding practices
- Integrates with Visual Studio, Azure DevOps, Jenkins, GitHub, GitLab, and other CI/CD platforms
- Provides clear remediation guidance, CWE links, and fix recommendations
- Offers analytics dashboards and centralized risk reporting for compliance and audit tracking
- Backed by security research and regular rule pack updates
Limitations and Shortcomings
While Veracode provides strong security analysis for C#, it comes with some architectural and practical trade-offs:
- Precompiled binary scanning limits source-level context
Because Veracode operates on compiled code, it lacks visibility into some development-time constructs, such as commented-out insecure code, code comments, or fine-grained control flow conditions. Developers must compile their apps before uploading. - No support for real-time, IDE-based feedback
Unlike tools like Roslyn Analyzers or ReSharper, Veracode does not provide inline or interactive warnings during development. Vulnerabilities are surfaced only after the binary is built and uploaded. - Slower feedback loops in CI/CD
Although integrated with many pipelines, the process of uploading binaries and waiting for analysis results may slow down rapid iteration or test-driven workflows. Not suitable for tight development cycles without tuning. - Limited static code quality or style enforcement
Veracode is focused on security flaws rather than general code quality, architecture validation, or formatting. Teams often need to pair it with tools like StyleCop, NDepend, or ESLint equivalents for full coverage. - Enterprise-level pricing
Costs are generally prohibitive for smaller teams. The platform is positioned for mid-to-large-scale enterprises with the budget and processes to support security-driven development. - Lack of rule customization
Compared to open-source or locally hosted tools, Veracode offers limited ability to customize or create new detection rules for proprietary coding patterns or niche C# APIs.
Veracode is a solid solution for organizations looking for a cloud-based, secure-by-default approach to static analysis with governance and audit features. However, teams that need instant developer feedback or source-level control may find the platform less responsive than IDE-integrated or open-source alternatives.
Klocwork
Klocwork, developed by Perforce, is a static application security testing (SAST) tool designed for high-assurance software development. It supports a wide range of languages, including C#, C++, Java, Python, and JavaScript, and is heavily used in regulated and safety-critical industries like automotive, aerospace, defense, and healthcare.
For C# teams, Klocwork offers a powerful way to detect security vulnerabilities, code defects, and maintainability issues early in the development cycle.
Advantages
- Supports modern C# standards and integration with Visual Studio and MSBuild
- Detects buffer overflows, null reference exceptions, injection vulnerabilities, concurrency issues, and logic defects
- Strong focus on security compliance, offering built-in rule sets for OWASP Top 10, CWE, MISRA, and CERT standards
- Provides incremental analysis with just-in-time feedback as code changes, which helps prevent regressions
- Compatible with large, complex C# codebases without degrading performance
- Integrates with CI/CD pipelines including Jenkins, GitHub Actions, Azure DevOps, and more
- Offers traceability of defect flow and deep diagnostics to understand root causes
- Includes desktop plugin for developers and server-based reporting for managers and QA
- Scalable for distributed teams working on monolithic or microservice-based systems
- Enables security-focused development in DevSecOps and Agile settings
Limitations and Shortcomings
Despite being enterprise-ready, Klocwork has some challenges and areas that may hinder adoption or usability, especially for smaller or less regulated development teams:
- Complex configuration and steep learning curve
Initial setup and fine-tuning of analysis rules can require significant time and domain knowledge. Teams often need to allocate time for training or involve dedicated security engineers. - Heavier footprint compared to lightweight analyzers
Klocwork consumes more resources than simple tools like Roslyn or StyleCop, which may slow down CI pipelines or development environments on lower-spec machines. - Not developer-friendly by default
While plugins are available, developers may find the UX less intuitive compared to modern IDE-integrated tools. Interpretation of some findings may require senior expertise. - High cost and enterprise positioning
Licensing is priced for medium-to-large organizations. Small teams or open-source projects may find it out of reach. - Limited open-source community and extensibility
Unlike analyzers backed by community ecosystems (e.g., ESLint, Roslyn), Klocwork is proprietary, with less flexibility to extend or write custom rules without vendor support. - UI and report experience
The user interface for reporting and triaging issues is functional but dated. Some teams report usability issues with large numbers of findings.
Klocwork is well-suited for enterprise or mission-critical C# development environments that demand compliance, secure code, and formal defect tracking. However, it may not fit smaller Agile teams or organizations looking for fast, developer-friendly feedback and tooling flexibility.
Semgrep
Semgrep is an open-source static analysis tool developed by r2c (ReturnToCorp) that emphasizes simplicity, speed, and rule-based scanning across many languages, including C#. It is particularly popular among security engineers and DevSecOps teams because of its pattern-matching capabilities and its ability to catch both security issues and code quality problems with customizable rules.
Semgrep supports C# in both community and commercial tiers, offering cloud and self-hosted deployment models.
Advantages
- Lightweight and fast CLI-based analyzer with support for modern C# syntax
- Easy-to-write and understand YAML-based rules allow custom patterns specific to an organization’s coding practices
- Good fit for DevSecOps pipelines due to fast execution and CI/CD integration with GitHub Actions, GitLab CI, Azure DevOps, and others
- Built-in rule libraries for security, maintainability, and performance (including OWASP Top 10, SANS 25, and more)
- Strong support for shifting security left, catching issues before merge or deployment
- Works well for enforcing secure patterns and best practices across shared codebases
- Cloud platform (Semgrep Cloud Platform) includes dashboards, PR commenting, audit logs, and team-based rule enforcement
- Extensible with Semgrep Supply Chain and Semgrep Secrets for deeper application security coverage
- Vibrant community and constantly growing open rule registry
- Free tier available with generous limits and no barrier to entry for small teams
Limitations and Shortcomings
Despite its flexibility and speed, Semgrep has notable limitations when applied to C# code, particularly for deep static analysis tasks:
- Partial language support for C#
Compared to its mature support for JavaScript, Python, or Go, Semgrep’s C# support is still developing. It may not fully parse or understand advanced C# features like LINQ, async/await flows, generics, or complex expression trees. - No deep data flow analysis
Semgrep excels at syntactic and semantic matching but lacks advanced control flow and taint analysis that tools like Coverity, Klocwork, or CodeQL offer. This can limit its ability to detect vulnerabilities that span multiple files or method calls. - Limited IDE integration
Unlike Roslyn-based analyzers or ReSharper, Semgrep doesn’t provide inline diagnostics inside Visual Studio or Rider by default. Developers must rely on CI feedback or use it as a manual scan tool unless custom integrations are created. - No visualization or architectural analysis
There’s no support for dependency graphs, code metrics, or architecture validation features often required by enterprise teams. - Steep learning curve for rule creation
While basic rules are easy to write, creating reliable, noise-free patterns for large C# codebases may require detailed knowledge of Semgrep’s abstract syntax tree structure and language internals. - More effective in security workflows than general quality enforcement
Semgrep’s strengths lie in security scanning and policy compliance. It’s not as full-featured for enforcing style conventions or doing cyclomatic complexity checks as tools like NDepend or StyleCop.
Semgrep is an excellent choice for modern teams adopting DevSecOps practices who need customizable, fast, and collaborative scanning. For C# development, it works best as part of a multi-tool strategy rather than a full replacement for deep analyzers or IDE-native solutions.
CodeQL
CodeQL, developed by GitHub (now part of Microsoft), is a semantic code analysis engine that allows querying source code as if it were data. It builds a relational database from the codebase and enables users to write queries to detect security vulnerabilities, performance issues, and coding flaws. As part of GitHub Advanced Security (GHAS), CodeQL plays a central role in large-scale vulnerability hunting, especially for open source.
C# is among the officially supported languages, and GitHub has been expanding its support for .NET-based ecosystems.
Advantages
- Enables deep semantic analysis of C# code, modeling control and data flows to detect complex, multi-step vulnerabilities
- Works with GitHub-native workflows, offering seamless integration into pull requests, push events, and scheduled security scans
- Can detect hard-to-find issues like insecure deserialization, unvalidated inputs, path traversal, and injection patterns
- Backed by GitHub’s growing query libraries, including OWASP Top 10 and CWE-aligned rules
- Provides full control to write custom CodeQL queries using a specialized language based on Datalog
- Strong version control awareness, able to track changes across branches and PRs
- Suitable for large codebases and multi-repo organizations thanks to GitHub Actions-based scaling
- Open-source query packs allow reuse and sharing of community-developed security checks
- Enables historical code review and vulnerability auditing for security researchers
- GitHub security team uses CodeQL internally for global CVE hunting, making it battle-tested in high-impact use cases
Limitations and Shortcomings
Despite being one of the most powerful tools available for deep static analysis, CodeQL has several caveats when applied to C# in day-to-day development:
- Steep learning curve for custom rules
Writing custom queries requires knowledge of the CodeQL query language, which has a unique syntax and semantic model. Most developers need dedicated training or time to become productive. - Requires building code databases
Before any query can run, the code must be compiled and transformed into a CodeQL database. This step adds complexity and time to CI pipelines, especially for large or frequently changing repositories. - Limited by source language coverage and tooling
While C# is supported, it may lag behind CodeQL’s primary language targets like Java, JavaScript, and Python in terms of pre-built rules and query quality. Also, some advanced .NET-specific behaviors (e.g., reflection, runtime code generation) may be challenging to model. - Not suitable for stylistic or formatting rules
CodeQL isn’t designed to enforce style guides or code formatting. It’s strictly focused on logical, semantic, and security-based patterns. - Lack of IDE support
There is no direct integration with Visual Studio or Rider, so developers must rely on CI/CD feedback or use CLI tools manually. - Enterprise licensing needed for full features
GitHub Advanced Security (GHAS), which provides the managed CodeQL service, is only available for GitHub Enterprise Cloud and Server customers. This limits adoption for teams not using GitHub. - Limited value for smaller projects
For simple C# apps or teams seeking quick results, the setup and complexity of CodeQL may outweigh its benefits compared to lightweight tools like Roslyn or ReSharper.
CodeQL excels in organizations that prioritize security and are willing to invest in building custom query sets and workflows. It’s ideal for C# projects with high compliance requirements, multiple contributors, and a mature DevSecOps culture. For others, it works best as a complementary layer to traditional analyzers.
Aikido
Aikido Security is a newer player in the application security space, offering developer-friendly SAST, SCA, and secret scanning in a unified platform. It is built with simplicity and speed in mind, targeting modern development workflows with out-of-the-box integration for popular platforms like GitHub, GitLab, Bitbucket, and Azure DevOps.
Although it is not a traditional deep static code analyzer like ReSharper or CodeQL, Aikido supports C# and .NET projects, providing valuable insights especially in the areas of security vulnerabilities and dependency risks.
Advantages
- Lightweight and easy to integrate into CI/CD workflows for GitHub, GitLab, Bitbucket, and Azure
- Offers built-in scanning for SAST, SCA (Software Composition Analysis), and secrets in one platform
- Supports C# with common vulnerability detection patterns such as hardcoded secrets, SQL injection, and insecure dependencies
- Clean, modern UI designed for developers and DevOps teams rather than security experts
- Context-aware issue triaging and risk prioritization help avoid alert fatigue
- Enables policy-based controls, e.g., block merges if critical issues are found
- No setup needed for rule configuration, with auto-discovery of projects and languages
- Free tier available for small teams and open-source contributors
- Fast scan times with actionable output in pull requests
- Security-first company culture, with GDPR and ISO 27001 compliance
Limitations and Shortcomings
While Aikido is an impressive DevSecOps platform for modern teams, it does have constraints for those looking for deep static analysis or advanced code inspections specific to C#:
- Limited rule depth for complex C# code patterns
Aikido focuses more on security scanning than code quality, lacking many of the logical or performance-related checks that tools like NDepend or ReSharper provide. - Not ideal for detecting structural design flaws or refactoring suggestions
It won’t identify issues related to object model misuse, circular dependencies, or architectural smells common in enterprise-grade applications. - Lacks support for custom rule creation or fine-tuned configuration
Users can’t define their own static rules or extend detection logic easily, unlike with CodeQL or Roslyn analyzers. - No Visual Studio or IDE integration
All results are surfaced through the web interface or via pull request comments. Developers used to IDE-based linting may find this disruptive. - Primarily built around Git-based workflows
Teams using centralized source control or older deployment models may not benefit from its automation features. - Scanning mostly occurs in CI, not during local development
There’s no native tooling for pre-commit hooks or live code feedback within the developer workflow.
Aikido is best suited for security-conscious, cloud-native teams working with C# in modern CI/CD pipelines. It delivers fast insights and good coverage for common vulnerabilities and secrets. However, it should be complemented by traditional code analyzers for teams needing architectural analysis, custom rule flexibility, or advanced quality enforcement.
DeepSource
DeepSource is an automated code review platform that provides static analysis, bug detection, security scanning, and code formatting across multiple languages. Though it has stronger support for languages like Python, Go, and JavaScript, DeepSource has gradually expanded its support to C# and .NET ecosystems, aiming to help developers maintain clean, secure, and maintainable codebases.
It integrates with version control platforms like GitHub, GitLab, and Bitbucket to run static analysis on every commit and pull request.
Advantages
- Out-of-the-box static analysis support for C#, focusing on performance, bug risks, anti-patterns, and security vulnerabilities
- Seamless integration with GitHub, GitLab, and Bitbucket for real-time feedback on pull requests
- Offers autofix suggestions to speed up resolution of common code issues
- Unified dashboard for code health insights across repositories and teams
- Lightweight and zero-config onboarding with automatic detection of code structure
- Includes metrics like code churn, duplication, and coverage trends
- Provides quick insights into code quality regressions across time and branches
- Supports ignore rules, suppression, and severity tuning for better noise control
- Web UI is intuitive and suited for both developers and engineering leads
- Enterprise features include team-based permissions and compliance dashboards
Limitations and Shortcomings
Despite being a fast-growing platform, DeepSource presents several drawbacks when used specifically for C# projects in enterprise or large-scale development:
- C# support is less mature than for Python or JavaScript
DeepSource lacks the depth and breadth of static rules found in tools like Roslyn, ReSharper, or NDepend, especially for complex .NET application patterns. - Limited rule customization
Users cannot define custom static analysis rules using a domain-specific language or extend rule sets beyond what is natively supported. - No integration with Visual Studio
Developers working in IDEs like Visual Studio or Rider must rely on CI-based feedback or manually check results in the DeepSource web UI. - Focuses on code-level issues but doesn’t cover architecture-level analysis or code structure optimization.
- No support for advanced flow analysis or data tracing
This makes it less effective for detecting multi-line vulnerabilities or intricate security logic failures. - Premium features are locked behind enterprise plans
Features like historical tracking, compliance reporting, or policy enforcement require higher-tier licenses. - Primarily cloud-based, with limited on-premise options for highly regulated environments
DeepSource is a great option for small to mid-size C# teams who want quick and automatic static analysis without deep configuration. It works best in Git-based CI workflows and complements traditional code linters. For enterprise-grade projects or teams seeking architectural insights and deep .NET internals support, it may need to be paired with other specialized analyzers.
Infer#
Infer# is a static analysis tool for C# developed by Microsoft Research, based on Facebook’s Infer framework. It focuses on interprocedural analysis, allowing it to detect complex bugs such as null dereferences, resource leaks, race conditions, and memory issues across method boundaries. Infer# is aimed at helping developers catch deep semantic bugs that would typically escape conventional linters or surface only during runtime.
It works by converting .NET Intermediate Language (IL) to an internal representation, then performing advanced formal verification analysis.
Advantages
- Based on Facebook’s Infer engine, widely respected for advanced static analysis of mobile and server-side code
- Performs interprocedural and symbolic analysis, detecting issues that span multiple methods or classes
- Especially useful for identifying null pointer dereferences, memory leaks, and concurrency issues
- Capable of reasoning about .NET Intermediate Language (IL), enabling analysis across all .NET-supported languages
- Actively developed by Microsoft Research with a strong academic foundation
- Open-source, with permissive licensing for enterprise or academic use
- Integration possible with MSBuild and CI pipelines for automatic analysis
- Useful in research settings, secure coding audits, or as part of formal verification workflows
- Detects potential runtime crashes and logic faults that are hard to catch with standard tools
Limitations and Shortcomings
While Infer# is powerful in its scope, it has multiple shortcomings that limit its usability for general development workflows:
- Not a full-featured static analyzer for general code style, design, or maintainability
Infer# focuses narrowly on bug detection and does not provide code quality metrics, complexity analysis, or architectural insights like NDepend or ReSharper. - No integration with Visual Studio or IDEs
All interaction is command-line driven. It is not suitable for developers expecting in-editor feedback or autofixes. - High technical barrier to entry
Requires knowledge of IL, command-line operations, and possibly some familiarity with formal methods to interpret certain outputs. - Sparse documentation and community support
Compared to tools like Roslyn analyzers or SonarQube, Infer# lacks extensive tutorials, examples, or active forums for troubleshooting. - Not actively maintained for broad production use
It is a Microsoft Research project, which means it may not receive consistent updates or production-grade support. - No SCA (dependency) scanning or security-specific rules
It cannot detect outdated packages, insecure API usage, or other surface-level security concerns. - Scalability concerns on large enterprise projects
Analysis can be slow and consume considerable system resources when applied to large codebases.
Infer# is best suited for teams prioritizing formal bug detection, research-heavy environments, or audits where deep path-sensitive analysis is required. It is not a turnkey solution for day-to-day static analysis in typical enterprise C# development, but serves as a strong complementary tool in secure or safety-critical development contexts.
Puma Scan
Puma Scan is a static analysis tool designed to identify security vulnerabilities in .NET and C# applications, particularly those related to secure coding practices and compliance. It is built with a strong emphasis on OWASP Top 10 and CWE (Common Weakness Enumeration) categories, making it a popular choice among security-conscious .NET teams.
The tool is available in two main forms: Puma Scan Community Edition, which is integrated into Visual Studio, and Puma Scan Professional, which adds enterprise features such as CI/CD integration, rule customization, and centralized reporting.
Advantages
- Tailored for .NET and C# security scanning, with a ruleset aligned to OWASP and CWE standards
- Integrates directly into Visual Studio, giving developers immediate feedback during coding
- Offers code flow analysis that can trace how untrusted input flows through the code, detecting issues like XSS, SQL injection, command injection, etc.
- Professional edition supports CI/CD pipeline integration, suitable for DevSecOps practices
- Generates detailed reports including vulnerability categories, severity levels, and remediation guidance
- Custom rules can be added for proprietary code patterns (Professional only)
- Helps teams enforce secure coding policies early in the SDLC
- Designed to complement secure development lifecycle requirements for regulated industries
- Maintained by Secure Development Solutions, with ongoing ruleset updates
Limitations and Shortcomings
While Puma Scan provides strong C# security analysis, it has some notable limitations, especially when compared with broader static analysis platforms:
- Focus is exclusively on security
Puma Scan does not offer analysis for performance issues, maintainability, code smells, or design flaws. It is not a general-purpose static analyzer. - Community edition is limited
It lacks CI/CD integration, team reporting, custom rules, and support. Only the Professional edition is viable for enterprise use, which may require additional licensing. - Rule set breadth is narrower than large platforms like Fortify, Checkmarx, or Veracode.
Puma Scan may miss vulnerabilities that require more advanced taint tracking or context-aware scanning. - No visualization or architectural insights
Unlike tools like NDepend, Puma Scan does not provide call graphs, dependency maps, or code structure analysis. - Lack of support for SAST across multiple languages
Puma Scan is focused solely on C#, meaning it’s not ideal for polyglot codebases or full-stack teams needing JavaScript, Java, or Python scanning. - Updates and community are smaller in scale
Compared to security-focused ecosystems like Snyk or GitHub’s CodeQL, Puma Scan has a more limited user base and community support.
Puma Scan is best suited for security-first C# development teams that want to shift-left vulnerability detection and maintain secure code as part of their daily workflows. It can be particularly valuable in compliance-sensitive industries like finance or healthcare. However, teams seeking more comprehensive analysis or broader language support may need to combine Puma Scan with complementary tools.
Security Code Scan
Security Code Scan (SCS) is a free and open-source Roslyn-based static analysis tool designed to identify security vulnerabilities in C# and .NET applications. It integrates directly into the build pipeline and developer workflow through Visual Studio and MSBuild, focusing primarily on detecting insecure coding patterns, especially those flagged by OWASP Top 10 and CWE standards.
SCS is especially valuable for developers seeking lightweight, security-focused feedback during development, with no need for complex setup or heavy licensing.
Advantages
- Built using the Roslyn compiler platform, making it highly compatible with the .NET ecosystem
- Seamless integration with Visual Studio and MSBuild, allowing real-time detection and feedback
- Targets common vulnerabilities such as:
- SQL Injection
- XSS (Cross-Site Scripting)
- Hardcoded credentials
- Insecure deserialization
- Command injection
- Lightweight and fast; doesn’t impact build performance significantly
- Can be added to CI/CD pipelines via NuGet or GitHub Actions for automated scanning
- Frequent updates and an active GitHub repository
- Good starting point for secure development practices in C# projects
- Supports output in SARIF format, making it compatible with security dashboards and aggregators
Limitations and Shortcomings
Despite its strong utility for C# developers, Security Code Scan has several limitations that impact its suitability in larger or more regulated environments:
- Limited scope
It only scans for security vulnerabilities. It does not detect code quality issues, performance bottlenecks, or architectural violations. - Basic vulnerability detection
While SCS catches common mistakes, it lacks advanced taint tracking, deep interprocedural analysis, and data flow modeling found in enterprise-grade tools like Fortify or CodeQL. - No UI, dashboard, or reporting layer
Developers must rely on build output or IDE warnings, with no visualization, history tracking, or centralized report management. - Limited customization
SCS does not allow fine-tuned rule configuration or the creation of custom rulesets to cover proprietary threats. - No support for non-.NET languages
SCS is strictly for C#/.NET. It cannot help teams managing polyglot stacks or cross-platform applications. - Not ideal for high-security or compliance-heavy environments
While helpful for prevention, SCS doesn’t offer the depth or auditability required by standards like PCI-DSS or ISO 27001 on its own.
Security Code Scan is best for individual developers or small teams looking to introduce basic secure coding checks early in the development process without adding complexity. For enterprise applications or security-critical systems, it serves best as a supplement to more advanced and comprehensive application security platforms.
SonarQube
SonarQube is a popular open-source platform for continuous inspection of code quality, supporting a wide range of programming languages, including C#. It analyzes code for bugs, vulnerabilities, code smells, and duplications, helping teams enforce quality gates and maintain healthy codebases. The tool is widely used in both small teams and large enterprises for DevOps integration and ongoing quality monitoring.
SonarQube supports C# analysis through the SonarC# plugin and is compatible with .NET Core, .NET 5+, and older .NET Framework applications. It integrates well with popular CI/CD systems and IDEs such as Visual Studio.
Advantages
- Comprehensive static code analysis including bugs, vulnerabilities, code smells, technical debt, and maintainability metrics
- Built-in support for C# and many other languages, ideal for multi-language projects
- Provides a centralized dashboard for visualizing code quality trends, coverage, and hotspots
- Supports custom quality gates, enforcing coding standards during pull requests or CI builds
- Integrates with GitHub, Azure DevOps, Jenkins, GitLab, Bitbucket, and many CI/CD platforms
- Highlights issues directly in Visual Studio when used with SonarLint
- Offers security-focused rules mapped to CWE, OWASP, and SANS standards
- Generates detailed reports and historical data to track regressions and improvements
- Free Community Edition with essential features, and paid tiers for advanced enterprise use cases
- Supports branch and PR analysis, helping prevent quality degradation before merges
Limitations and Shortcomings
Despite its strengths, SonarQube has several drawbacks when used for C# static analysis in more advanced or security-sensitive environments:
- Limited depth for security analysis
While it covers basic vulnerabilities, SonarQube does not provide deep taint analysis or interprocedural flow tracking like Fortify, CodeQL, or Checkmarx. - Rule customization is constrained in the Community Edition
For advanced rule editing, governance, and compliance reporting, the Developer or Enterprise Edition is required, which adds cost. - Performance can degrade on large codebases
Analyzing very large solutions may lead to long scan times and require infrastructure tuning. - Requires setup and maintenance
On-premise deployments demand configuration, database support, backups, and updates, which might burden smaller teams. - Lacks runtime context
Static-only analysis means it may produce false positives or miss context-specific runtime issues. - No native support for threat modeling or architectural visualization
It doesn’t provide insight into code structure, dependencies, or software architecture the way NDepend or Resharper does. - Security rules may not be sufficient for regulated industries
While helpful for general awareness, the platform’s security capabilities are often supplemented by other dedicated SAST tools in enterprises.
SonarQube is a highly effective tool for enforcing code quality and continuous inspection, particularly in DevOps pipelines. However, for deep security assurance or architectural oversight, it is best used in combination with other specialized tools in a multi-layered static analysis strategy.
Navigating the Landscape of C# Static Code Analysis
In an era where software reliability, performance, and security are under constant scrutiny, static code analysis has become an indispensable element of the software development lifecycle for C#. Whether the goal is to catch critical bugs early, ensure regulatory compliance, or maintain clean architecture, there is no shortage of tools promising to deliver insight and assurance.
From advanced commercial platforms like Coverity, Fortify, and Veracode, to community-backed utilities like StyleCop, FxCop, or Security Code Scan, developers and enterprises alike are presented with a broad spectrum of solutions. Each comes with unique strengths some offer deep vulnerability scanning, others prioritize architectural modeling, developer productivity, or seamless CI/CD integration.
What stands out is the growing importance of multi-tool strategies. Modern engineering organizations rarely rely on a single analyzer. Instead, they blend IDE-integrated linters like ReSharper, CodeRush, or Roslyn Analyzers with enterprise-level SAST tools for layered visibility. Meanwhile, DevSecOps teams are increasingly embedding solutions like Semgrep, Snyk, or CodeQL into automated pipelines, ensuring that vulnerabilities are addressed long before deployment.
Amid these choices, SMART TS XL emerges as a powerful and flexible player — offering enterprise-grade static analysis capabilities with broad rule customization, precise COBOL and legacy support, and now, expanding reach into modern C# codebases. Its ability to bridge traditional and cloud-native development contexts makes it especially valuable for large, regulated, or hybrid organizations looking to unify quality and security in a single platform.
Selecting the Right Tool for the Job
Ultimately, the “best” static analysis tool for C# is highly context-dependent. Teams must weigh factors such as:
- Size and complexity of the codebase
- Security and compliance requirements
- Integration with development environments and CI/CD pipelines
- Customization and rule extensibility
- Cost, licensing, and support needs
No single tool does it all. The real value lies in creating a well-integrated stack of analyzers, linters, and scanners tailored to your workflows and risks.
By combining thoughtful tool selection with development best practices, teams can significantly reduce technical debt, increase security posture, and empower developers to write better, safer, and more maintainable C# code every day.